What does this app do?
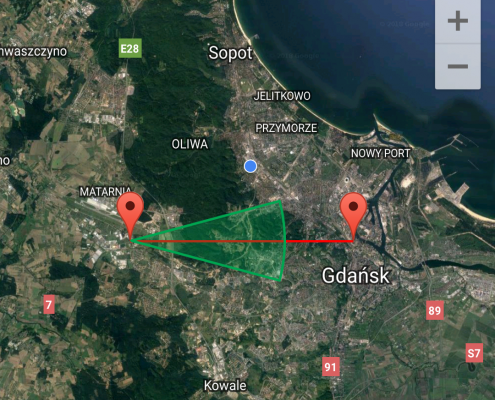
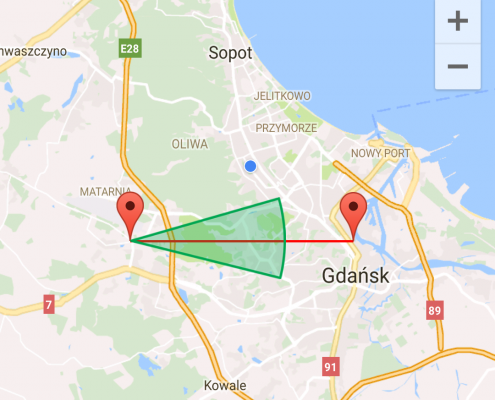
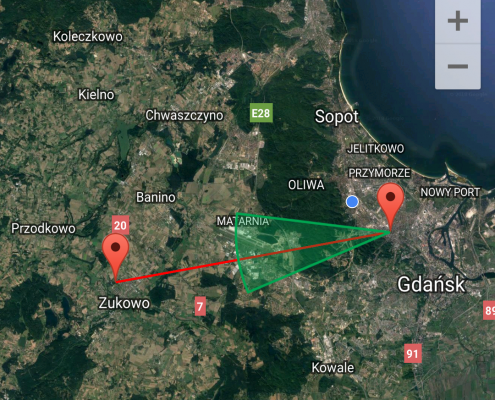
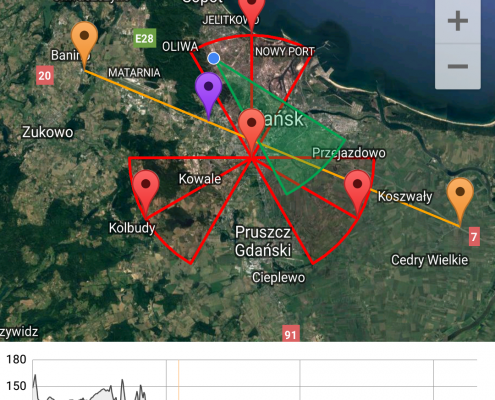
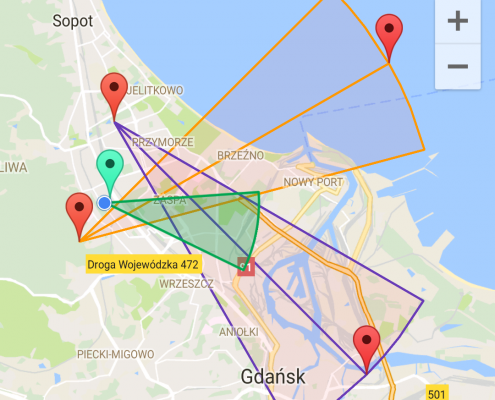
Antenna Pointer will help you to proper align all types of antennas and to validate existed ones. This app is design especially for GSM, LTE technicians, WISP operators and network validators. It draws lines and sectors on map based on given data (like for example azimuth, distance, location).
This app doesn’t contains any data (especially nearest GSM towers, user must create own data) – so if you looking for app which will show you nearest GSM tower – find another one. But if you’re technician who need tool to see azimuths, sectors, and other data based on own data – this app may help you.
Where can I find this app?
In Google Play store:
– https://play.google.com/store/apps/details?id=com.esys.antennapointer
– https://play.google.com/store/apps/details?id=com.esys.antennapointerpro
First one is free version – with ads and limited functions, second one is paid one – without any limits. Please try free version first – if you will find this app helpful for you – I will be glad if you buy Antenna Pointer PRO.
App requirements
This app should run on all android devices with screen bigger than 5.0” and Android greater than 5.0. I suggest newest Android. It is recommended to turn on GPS. If your phone got magnetometer sensor (compass sensor) app will show you also azimuth.
Something is not working, I have a problem. What should I do?
If after reading manual you still have some doubts I encourage you to write me an email – I will try to answer as soon as possible. For more information on how to use the application, visit http://www.esys.com.pl/antenna_pointer.
How to use Antenna Pointer?
In the application there are two menus – left side and top (and in the case of the transmitter control also lower). In the side menu you select the application modes, sets all options, etc. In the top menu there are options specific to the operating mode.
Available operating modes are:
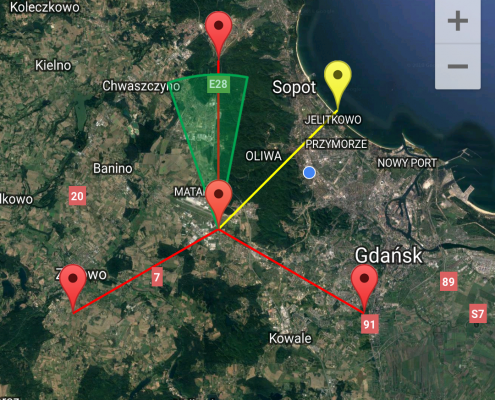
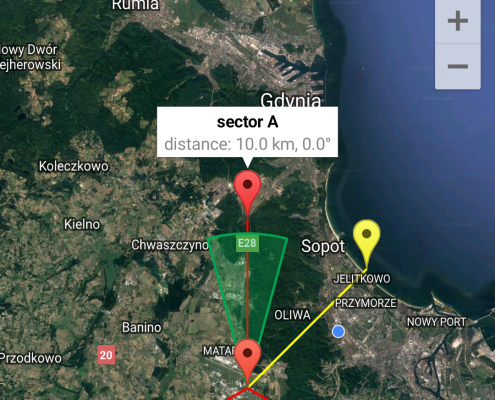
- Azimuth – set the antenna to the desired azimuth. You simply point your position on the map – and app draws the azimuth lines,
- Point-to-point – draws lines between two locations,
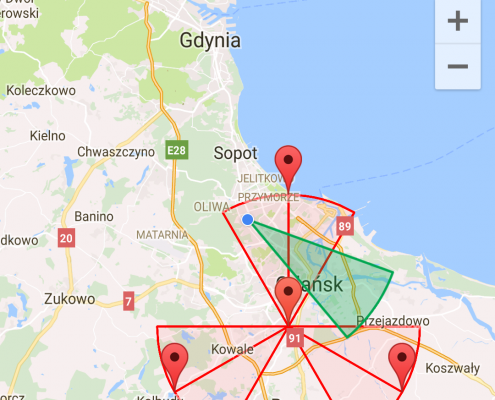
- Transmitter Vadilation – If you need to check the transmitter’s range in the field.
Regardless selected mode you still need to point your location and the options specific to the selected operating mode.
How can I enter location?
There are several ways:
- long tap on map,
- Drag the existing marker to a new location on the map,
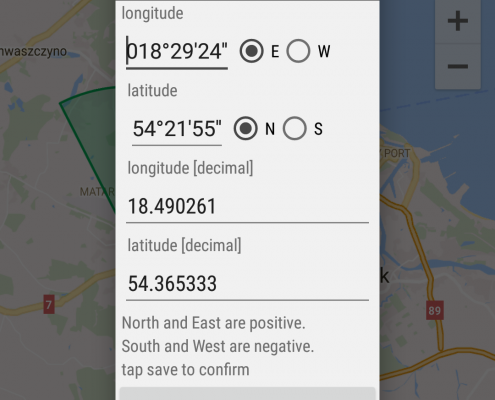
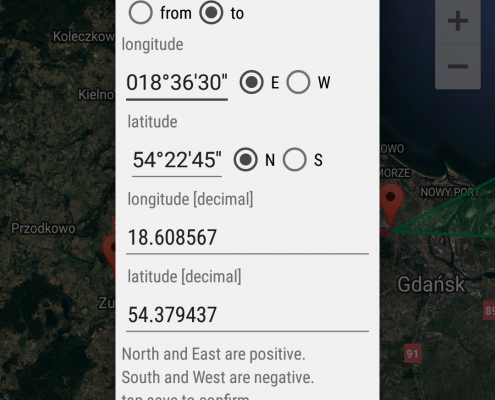
- Enter the longitude and latitude (top menu),
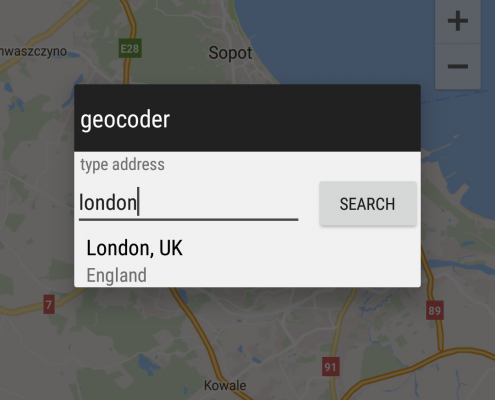
- Enter the address (top menu),
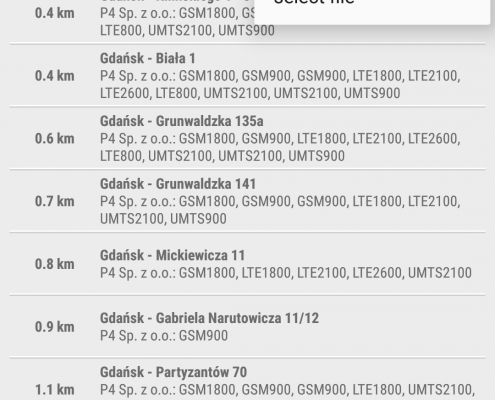
- Select a location from the file (Top menu).
Compass show wrong direction – what should I do?
The easiest way is to calibrate it. I recommend calibration before each use. I do this like this: https://www.youtube.com/watch?v=sP3d00Hr14o
OPERATION MODES
AZIMUTH
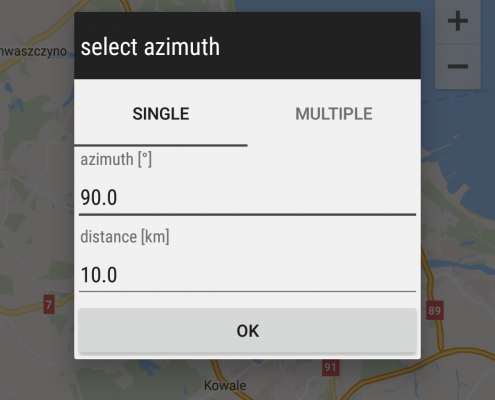
If you set the antenna to the desired azimuths, you probably already know that the steel structures and electrical current abuse compass indications. With Antenna Pointer you will no longer need to print the maps before mounting or correcting antennas. If you have GPS turned on, your location should be quickly found. Now you need to hold the place on the map where antenna is and from the top menu select azimuth and distance to draw the necessary lines on the map.
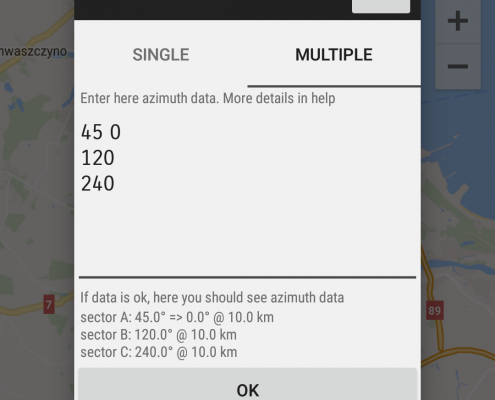
If you need more than one line of azimuth you need to tap second card and enter proper azimuth data. The only difference is how the azimuth data is entered.
- Each entry (azimuth) must be entered on a separate line.
- By default, the line length is 10 km. To change the length, specify the distance after the „:” Character,
g. 135:5
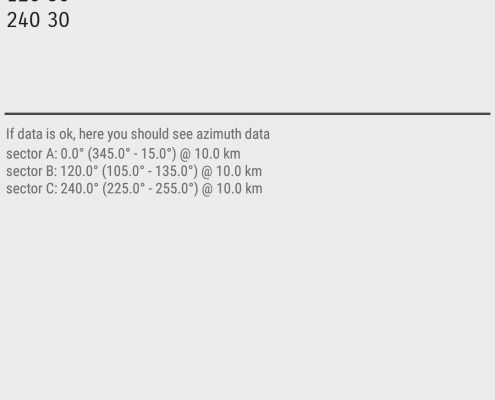
that mean: azimuth 135 degrees, distance 5 km. - If you are correcting transmitter antennas azimuths, you can also specify pre-correction values for example.
120 130 means a change of azimuth from 120 to 130 degrees. Similarly, you can specify the distance after „:” symbol. - Only numbers are taken into account, so for example. Type:
From 120 to 130 degrees, it will be read as a change from 120 to 130 degrees. Thus, for example, It should be easier to prescribe the given values from SMS. - Always check in the box below the window for entering data sector data-in this way you make sure that everything is OK.
POINT TO POINT
This mode works almost the same as azimuth with the difference that instead azimuth you specify the location.
TRANSMITTER VALIDATION
This mode is designed for all those who need to control the transmitters, search for interference with other transmissions etc. In this mode it is possible to plot on map background with sectors, control points, etc. You can enable the data recording mode. In this mode all data with GPS is saved to file. With acoustic notifications you also know when you leave the sector.
How can you draw sectors?
You can draw sectors in multiple ways. You can draw sectors on www.gpsvisualizer.com/draw/ and save it as *. gpx. The advantage of this solution is that you can draw any path on the map with control points.
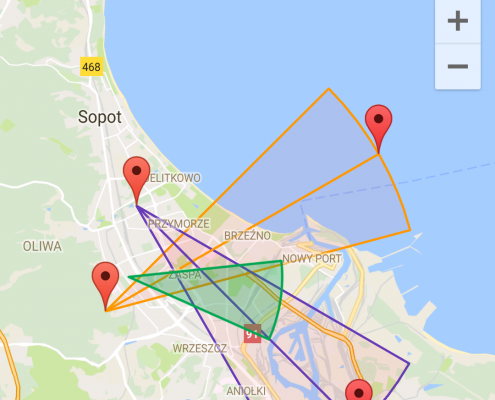
The second method is to use the built-in Sector editor. The editor allows you to draw sectors around the selected transmitter. Azimuth, azimuth width and distance can are describing sector. The syntax is similar to other modes:
- Each line is a single sector.
- Distances are given after the symbol „:”
- Specifying one value draws a line on the map with the specified azimuth
- Specifying two values draws a symmetric sector – the measure is the first value, the sector width is the second value
- Specifying the three values draws an asymmetric sector – the measure is the first value, the other two are sector boundaries.
Bottom menu
The bottom menu contains frequently used options. You can here:
- disable position tracking – by default app get location from GPS and put a marker in middle of the screen – if you don’t want to track location – here you can turn it off,
- lock the transmitter – by default, long tap on map change location, here you can disable it,
- plot terrain profile – this option plot terrain profile between two selected points. To delete profile line on map long tap function icon (not description)
- enable/disable track logging.
Markers
On map you can insert marker everywhere. To do this use the Marker menu (from top menu). Markers can be imported or exported. Markers are saved in *. Csv files – so you can easily edit them in almost any text editor or spreadsheet. The files should be encoded in UTF-8 and every column should be separated by semicolons.
Unfortunately, older versions of Microsoft Excel automatically replaces the semicolon-separated columns with tabs and changes the code page to ANSI. If Antenna Pointer don’t want to import those files – please convert it to proper format in f.e. Notepad or Notepad++.
Typically, each marker is in a new line of the file. e.g.
54,12345619,123456;Name;Description; 100; 1
- Each row contains (from left):
- Latitude (can be separated by a comma or a period),
- Longitude (can be separated by a comma or a period),
- Name,
- Description,
- Color (values 0-359),
- Active/Hidden marker (1 – Active, 0 – hidden).
Terrain Profile
From the bottom menu, you can call the Terrain profile option. Once it is called you must select on the map two points (by long tapping the points on map) – then the profile line should be shown. When you click point on a chart, the marker should appear on the map at the location described in the elevation chart.
To delete line on the map, long tap the terrain profile icon (not the description).
RAPORTS
The report is used to save the Antenna Pointer map in HTML. To properly generate the report, you must:
- Select map mode and draw anything you need on map.
- Go to the reports and save raport.
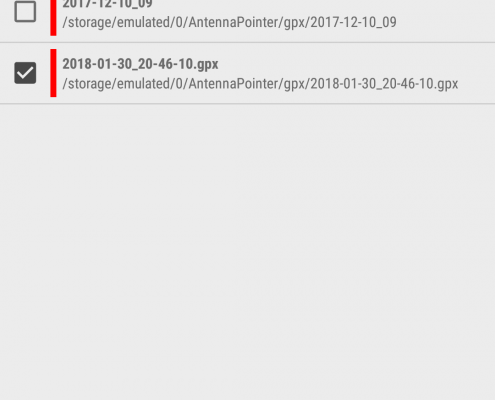
In transmitter validation mode you can generate data only from saved GPX files with saved GPS data.


